
Day14 ML Review - R-Squared (1)
Concepts Overview, Mathematical Calculation, and Interpretation

R-squared, or the coefficient of determination quantifies the proportion of the variance in the dependent variable that is predictable from the independent variables in a regression model.
Definition
R-squared is a statistical measure that indicates how closely the data in a regression line fits the actual data point. It measures how well the observed outcomes are replicated by the model based on the proportion of total variation of outcomes explained by the model.
Formula
The formula for R-squared is:
- $\text{SSR}$ is the sum of the squares of the model residuals. It represents the variation that the model does not explain. The residuals are the differences between the model’s observed values and predicted values.
-
$\text{SST}$ is the total variation in the dataset. It is the sum of the squares of the differences from the actual values to the mean of the dependent variable.
$$ \text{Total Sum of Squares (SST)} = \sum^n_{i=1}(y_i- \bar{y_i})^2 $$ $\bar{y}$ is the mean of the observed data $y$.
The R-squared value can be interpreted as the percentage of the response variable variation explained by a linear model. Essentially, it indicates goodness of fit; a higher R-squared value indicates a better fit. Therefore, it measures how well the model will predict unseen samples, assuming it reflects the underlying data-generating process.
How To Interpret R-squared in Regression Analysis
Mostly explanation from: https://statisticsbyjim.com/regression/interpret-r-squared-regression
The R-squared statistic is a measure of how well the independent variables in a linear regression model explain the variance in the dependent variable. It shows the strength of the relationship between the model and the dependent variable on a scale of 0 to 100%.
Statisticians explain that a regression model is considered a good fit for the data when the variances between the observations and the predicted values are minimal and unbiased. In this context, unbiased refers to the idea that the estimated values are not consistently too high or too low across the entire range of observations.
(Before evaluating numeric measures of goodness-of-fit, such as R-squared, it’s important to examine the residual plots. Residual plots can reveal biased models more effectively by displaying any problematic patterns in the residuals. If your model is biased, the results cannot be trusted. If your residual plots look good, then you can proceed to assess your R-squared and other statistics.)
The R-squared value measures how closely the data points fit the regression line. It is also known as the coefficient of determination in simple linear regression and as the coefficient of multiple determination in multiple regression. In the same data set, higher R-squared values indicate that the observed data points are closer to the fitted values. (the larger the $R^2$, the better the regression model fits your observations)
R-squared is always between 0 and 100%:
-
The R-squared value of 0% indicates that the model does not explain any of the variation in the response variable around its mean. This means that the mean of the dependent variable is as accurate in predicting the dependent variable as the regression model.
-
On the other hand, an R-squared value of 100% indicates that the model explains all the variation in the response variable around its mean.
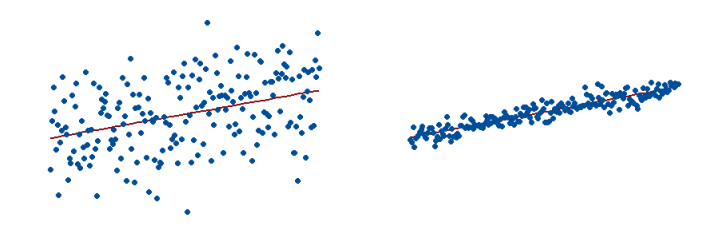
The R-squared for the regression model on the left is 15%, and for the model on the right, it is 85%. When a regression model accounts for more of the variance, the data points are closer to the regression line. In practice, you’ll never see a regression model with an R-squared of 100%. In that case, the fitted values equal the data values and consequently, all the observations fall exactly on the regression line.
Limitations
Keep in mind the following information:
R-squared cannot be used to determine whether the coefficient estimates and predictions are biased, so you should evaluate the residual plots.
R-squared does not indicate whether a regression model offers a proper fit to your data. A strong model can have a low R-squared value. Conversely, a biased model can have a high R-squared value!
Leave a comment