
Day15 ML Review - R-Squared (2)
How R-Squared Is Used As a Performance Metric in Machine Learning

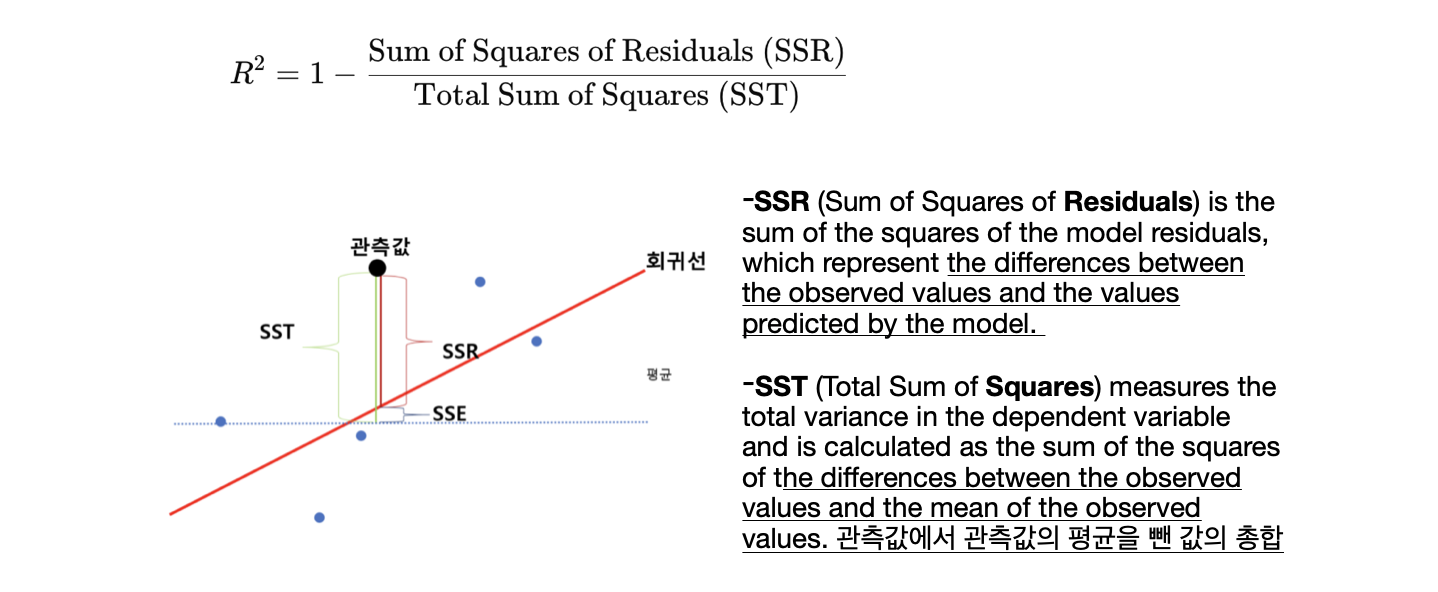
R-squared, a key performance metric in regression models in machine learning, is used to assess how well the model explains the variation in the response data. (The coefficient of determination is calculated as how well the linear model that I fit explains the variance of the data better than the mean value model.)
Detailed Usage
-
Evaluating Model Fit
- Goodness of Fit: R-squared measures how much of the variability in the dependent variable can be explained by the independent variable in the model. A higher R-squared value indicates that the model can explain a larger proportion of the variance, suggesting a better fit to the observed data.
- Comparison: When comparing different models, a higher R-squared value generally indicates a better explanatory model, assuming that other diagnostic tests support this conclusion.
-
Interpretation in Context
- Contextual Meaning: The value of R-squared is meaningful in relation to the data and the field of study. In highly predictable fields such as the physical sciences, a high R-squared is anticipated, whereas in less predictable fields like social sciences, a lower R-squared may still be deemed acceptable.
- Limitations: It is important to note that a high R-squared value does not guarantee that the model is flawless. It does not consider whether the model is biased, nor does it guarantee that omitted variable bias or multicollinearity is not impacting the predictors.
-
Not a Sole Metric
- Complementary Metrics: Although R-squared is useful, it is typically used in conjunction with other metrics such as Mean Squared Error (MSE), Mean Absolute Error (MAE), and possibly more advanced statistics such as adjusted R-squared (which accounts for the number of predictors in the model). These metrics offer a more comprehensive view of model performance.
- Model Validation: R-squared alone is insufficient to validate a model’s accuracy on data it has not been trained on. Cross-validation or splitting the data into training and testing sets can be used to accurately determine a model’s predictive power. R-squared is calculated for these subsets to ensure consistency and detect overfitting signs.
-
Practical Use Cases
- Model Development: In the model development phase, we monitor the R-squared value to track improvements as we add or modify different variables in the model. A significant increase in R-squared may indicate that a variable is a valuable predictor, while a minimal change might suggest that a variable is redundant or irrelevant.
- Reporting: In many scenarios, especially in academic and research settings, R-squared is reported as a key statistic to indicate the effectiveness of the regression model.
Leave a comment