
Day29 ML Review - Logistic Regression (1)
Basic Concepts and Sigmoid Function

(Python Machine Learning: Machine Learning and Deep Learning with Python, scikit-learn, and TensorFlow 2, 3rd Edition)
Although the perceptron rule provides a friendly and straightforward introduction to machine learning algorithms for classification, its main drawback is that it fails to converge if the classes are not perfectly linearly separable. To better utilize our time, let’s now explore another simple but more powerful algorithm for linear and binary classification problems: logistic regression.
Note that in spite of its name, logistic regression is a model for classification, not regression.
Logistic regression and conditional probabilities
It is easy to implement and performs well on linearly separable classes. Similar to the perceptron and Adaline, the logistic regression model is also a linear model used for binary classification. (Logistic regression can be readily generalized to multiclass settings, which is known as multinomial logistic regression or softmax regression. Another way to use logistic regression is via the OvR technique)
Key Characteristics of Logistic Regression
- Output: the output of logistic regression is a probability that a given input point belongs to a certain class, which is used to classify the input as class 1 or 0.
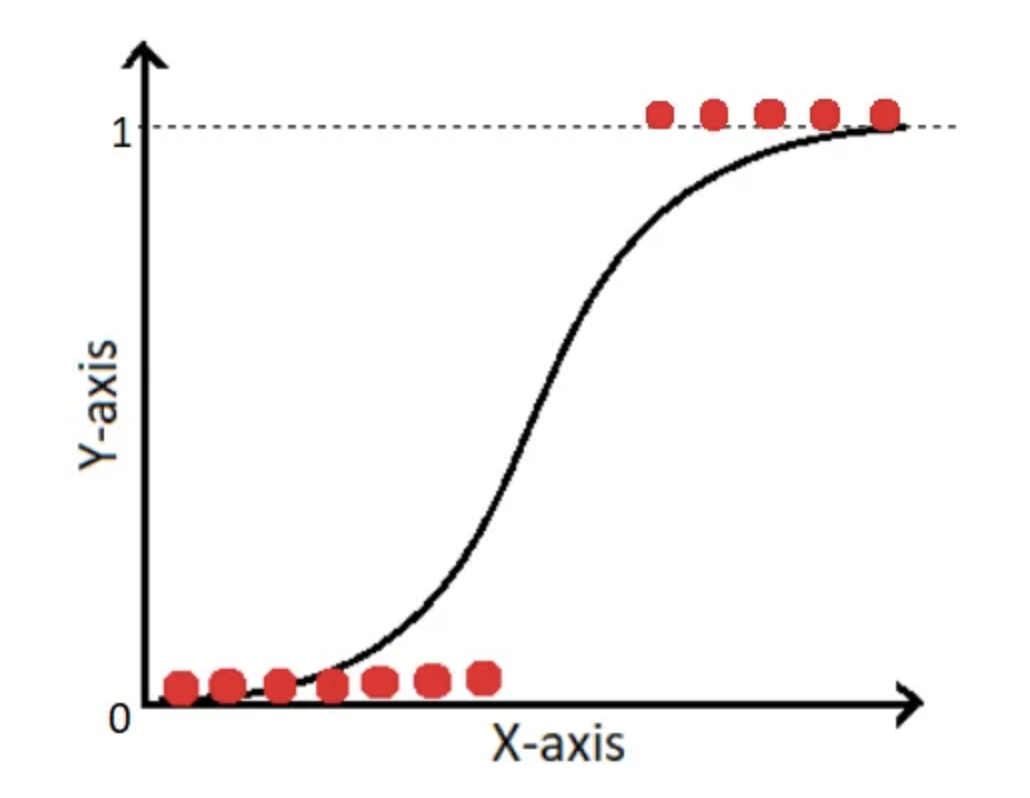
- Function: It uses the logistic function to bind the output between 0 and 1, ensuring the outputs are interpretable as probabilities. The logistic function, also called the sigmoid function, is an “S”-shaped curve that can take any real-valued number and map it into a value between 0 and 1, but never exactly at those limits.
The concept behind logistic regression as a probabilistic model for binary classification can be explained using odds, representing a specific event's likelihood. The odds can be represented as $\frac{p}{(1-p)}$, where $p$ represents the probability of the positive event that we aim to predict.
We can then apply the logit function, which takes input values in the range of 0 to 1 and transforms them to values over the entire real-number range. This allows us to express a linear relationship between feature values and the log-odds.
that a particular example belongs to class 1 given its features, $x$.
We want to predict the likelihood that a specific example is associated with a certain class, which is the reverse of the logit function. This function is also known as the logistic sigmoid function, commonly abbreviated to sigmoid function because of its distinct S-shape.
Here, $z$ is the net input, the linear combination of weights, and the inputs (that is, the features associated with the training examples):
Due to this sigmoid function that squeezes the output of the linear equation to a probability between 0 and 1, we can then decide on a decision boundary and use this probability to conduct the classification task.
The output of the sigmoid function is interpreted as the probability of a particular example belonging to class 1, given by $\phi(z) = P(y=1 \vert x;w)$.
The estimation of class-membership probability, provided by the sigmoid function before applying the threshold function, makes logistic regression particularly useful. For instance, it is used in weather forecasting to not only predict whether it will rain on a specific day but also to determine the likelihood of rain. Similarly, logistic regression can be helpful in predicting the likelihood that a patient has a specific disease based on certain symptoms, which is why it is widely used in the field of medicine.
Leave a comment