
Day07 ML Review - Linear Regression (1)
Concepts Overview and Mathematical Calculation Exercise

Overview
Linear regression models the linear relationship between a dependent variable and one or more independent variables. Linear regression aims to find a linear equation that best predicts the dependent variable from the independent variables.
Linear Regression is a data analysis technique that predicts the value of unknown data using known, related data values. It creates a mathematical model using a linear equation to represent the relationship between a dependent variable and one or more independent variables.
For instance, if you have data on your expenses and income for the past year, linear regression can help determine if your expenses are half your income. This analysis allows you to predict future expenses by halving the projected income. Linear regression models are simple and offer straightforward mathematical formulas for making predictions. This statistical technique is widely used in software and computing applications.
In Machine Learning, algorithms analyze large data sets and use that data to calculate linear regression equations. Data Scientists first train an algorithm on a known or labeled data set and then use that algorithm to predict unknown values.
Simple Linear Regression
The model predicts the outcome based on a single independent variable. The relationship between the dependent variable $y$ and the independent variable $x$ is defined by the equation:
- $\beta_0$ & $\beta_1$ are named as ‘regression coefficient’.
- $\beta_0$ is the intercept of the line (the value of $y$ when $x=0$)
- $\beta_1$ is the slope of the line, which represents the effect of the independent variable on the dependent variable. (the change in $y$ for a one-unit change in $x$)
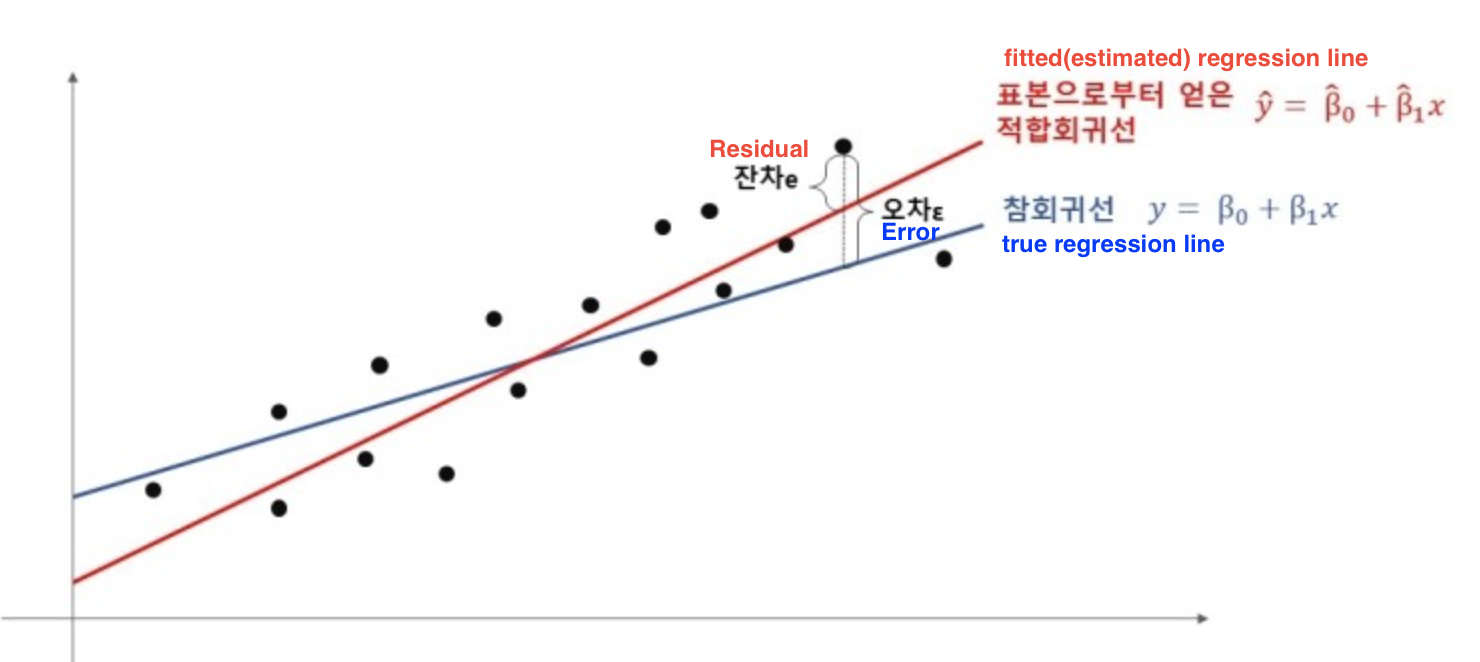
- $\epsilon$ is the error term which accounts for the variability in $y$ that cannot be explained by the linear relationship with $x$.
Estimating the Coefficients
The coefficients $\beta_0$ and $\beta_1$ are estimated using the least squares method, which involves minimizing the sum of the squared differences (residuals) between the observed values and those predicted by the model. The residuals are given by:
where $e_i$ is the residual for the $i$-th observation.
The sum of squared residuals (SSR) is:
To find the best-fit line, we take the partial derivatives of SSR with respect to $\beta_0$ and $\beta_1$, set them to zero, and solve for $\beta_0$ and $\beta_1$.
Solutions for $\beta_0$ and $\beta_1$.
The solutions for $\beta_1$ and $\beta_0$ from the normal equations are:
where $\bar{x}$ and $\bar{y}$ are the sample means of $x$ and $y$, respectively (It is impossible to calculate population parameters, so we must select samples).
Multivariate Linear Regression
\[\\ y=\beta_0+\beta_1x_1+\beta_2x_2+ \dots +\beta_nx_n+ \epsilon \\\]The multiple linear regression model counts on the multiple independent variables.
It is typically used for predicting continuous values and forecasting, but it can be used for classification tasks, such as binary classification. In such cases, a threshold is set, and values below the threshold predict one class, while values above predict another.
Linear regression is a parametric model that assumes a linear relationship between the input and output variables.
Limitations of Linear Regression
- Linearity Assumption: The biggest limitation is the assumption of linearity. Linear Regression assumes the relationship between the dependent and independent variables is linear. This can be overly simplistic as real-world data often exhibits non-linear patterns.
- Influence of Outliers: Linear regression models are highly sensitive to outlier values. Outliers can have a disproportionately large effect on the fit of the model, often skewing the entire regression line.
- Homoscedasticity: Linear regression assumes the variance of residual errors is consistent across all levels of the independent variables (homoscedasticity). The model’s predictions become less reliable if the error variance changes (heteroscedasticity).
- Independence: The model assumes that the observations are independent of each other. In cases where there is autocorrelation between observations (as often found in time series data), the standard model fitting procedures can yield unreliable estimates.
Exercise: Mathematical Calculation of Linear Regression
When you have the following four pieces of data, find the fitted regression line, the value $\hat{y_{i}}$ that approximates the fitted regression line and the residual.
- Find the fitted regression line.
$$ \bar{y} = \frac{3+4+8+9}{4} = 6 $$
$$ \text{S}_{xx} = (1-2.5)^2 + (2-2.5)^2 \\ + (3-2.5)^2 + (4-2.5)^2 = 5 \\ $$
$$ \text{S}_{xy} = (1-2.5)(3-6)+(2-2.5)(4-6)\\ +(3-2.5)(8-6)+(4-2.5)(9-6) = 11 \\ $$
$$ \implies \hat{\beta_1} = \frac{S_{xy}}{S_{xx}} = \frac{11}{5} = 2.2 $$
$$ \hat\beta_0 = \bar{y}-\hat{\beta_1} \ \bar{x}= 6 - (2.2)(2.5) = 0.5 $$
$$ \therefore \hat{y_{i} = 0.5 + 2.2 x_i} $$
- Approximate value to the fitted regression line
- Find Residuals
$$ \Rightarrow \sum_{i=1}^{4} e_i = 0 $$
As we confirm here, the sum of all residual values is **0**.
References in Korean
- Regression Coefficient: 회귀계수
- Residual: 잔차 잔차는 실제 자료와 적합회귀선(fitted regression line or estimated regression line) 의 오차이다.

Leave a comment